Core Data Insights
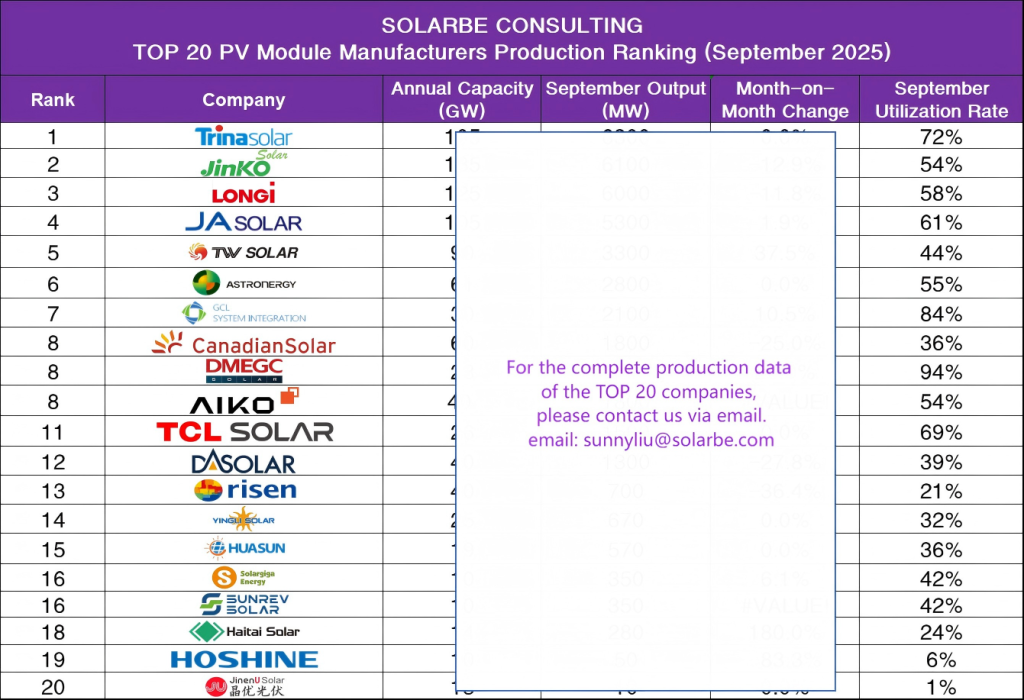
- Leading Player Structure Solidifies, But Internal Competition Intensifies. A “one superpower, multiple major powers” landscape has formed: Trina Solar, Jinko Solar, LONGi, and JA Solar form a stable first tier, with each exceeding 5 GW of output in September, creating a significant gap from other manufacturers.
- Noticeable Divergence in Monthly Changes: Within this top tier, Trina and JA maintained stable output or saw slight increases, while Jinko and LONGi experienced month-on-month declines exceeding 10%. This indicates significant divergence in production strategies even among giants, due to market demand and inventory pressures.
- Utilization Rates Generally Under Pressure, Overcapacity Becomes Industry Norm. Overall utilization rates are low: Among the TOP 20, only 3 companies exceeded a 70% utilization rate. The estimated industry average is only around 46%, meaning half of the total production capacity is idle.
Structural Overcapacity is the Core Contradiction
A massive gap exists between the annual production capacity exceeding 1000 GW and global market demand (estimated global new installations in 2025 at approximately 500-600 GW). This “supply glut” leads to fierce price competition, severely compressing corporate profit margins.
Industry Shakeout Accelerates, Concentration Expected to Increase Further
Output for manufacturers at the tail end has fallen below 500 MW per month. In an industry where economies of scale are crucial, this creates immense survival pressure. It is anticipated that within the next 1-2 years, some less competitive enterprises will be forced out or consolidated, with market share concentrating further towards leading companies and those with core advantages.
H2 2025 Trend Forecast
- “Price War” to Persist, But Intensity May Diverge: Price competition remains the main theme for clearing inventory and securing orders. However, the focus will shift from pure price undercutting towards comprehensive strength based on “technology, brand, and reliability.” The replacement of P-type by N-type technology will be largely complete.
- Utilization Rates to Fluctuate at Low Levels: Unless there is unexpectedly strong global demand, a significant overall increase in utilization rates is unlikely. Companies will flexibly adjust production based on orders, and “weak peak seasons” may become the norm.
- Technological Advancement Remains Key to Breaking the Deadlock: The mass production efficiency and cost advantages of advanced technologies like BC cells, TOPCon 2.0, HJT, and Perovskite will become core weapons for leading companies to differentiate themselves and improve profitability.
- Balancing Overseas Expansion and Domestic Market: Amid pressure in the domestic market, companies with strong overseas production layouts and channels (e.g., Jinko, Trina, Canadian Solar) will demonstrate greater resilience. Meanwhile, China’s domestic distributed market and large-scale base projects remain the fundamental market base.
Methodology Notes
This ranking is released by Solarbe Consulting, focusing on the production volume, capacity utilization, and production rhythm of Chinese PV module manufacturers. It utilizes four core indicators—Annual Capacity, Monthly Output, Month-on-Month Change, and Utilization Rate—to present a multi-dimensional view of the real production landscape.
- Data Logic: Cross-verification via multiple channels ensures objectivity and traceability. Data collection covers official company announcements, quarterly financial reports, industry research, and third-party verification, cross-checking Annual Capacity, Monthly Output, MoM Change, and Utilization Rate, considering both scale and operational dimensions.
- Data Boundaries: This ranking is a snapshot of the production side. Due to factors like production line commissioning, order cycles, and statistical caliber differences, the data is intended for industry trend analysis reference only. In case of any discrepancy with actual company operations, official disclosures shall prevail.
Disclaimer
Due to differences in information disclosure, this ranking does not guarantee real-time timeliness or absolute precision. Solarbe Consulting makes no warranties of any kind regarding the completeness, accuracy, or fitness for purpose of the content and assumes no liability for any direct or indirect losses arising from reliance on this information. To supplement or correct information, please contact sunnyliu@solarbe.com.


