According to data released by the National Energy Administration (NEA), China installed 59.71 gigawatts (GW) of new grid-connected photovoltaic (PV) capacity in the first quarter of this year, comprising 23.41 GW of centralized PV and 36.31 GW of distributed PV. Driven by policy-driven installation rushes ahead of key deadlines (April 30 and May 31), distributed PV once again surpassed centralized projects, becoming the dominant force in new grid-connected installations.
Regionally, Yunnan, Xinjiang, and Jiangsu provinces led in centralized PV installations during Q1, while Guangdong, Jiangsu, Zhejiang, and Anhui stood out for distributed PV. Notably, commercial and industrial (C&I) distributed PV emerged as the primary segment, accounting for 86% of nationwide distributed PV additions.
Feedback from manufacturing firms indicates that demand in the distributed PV market surged starting late February, driving module transaction prices above RMB 0.75/W. However, as deadlines for two major policy adjustments approached, prices from some top-tier manufacturers reverted to RMB 0.6X/W.
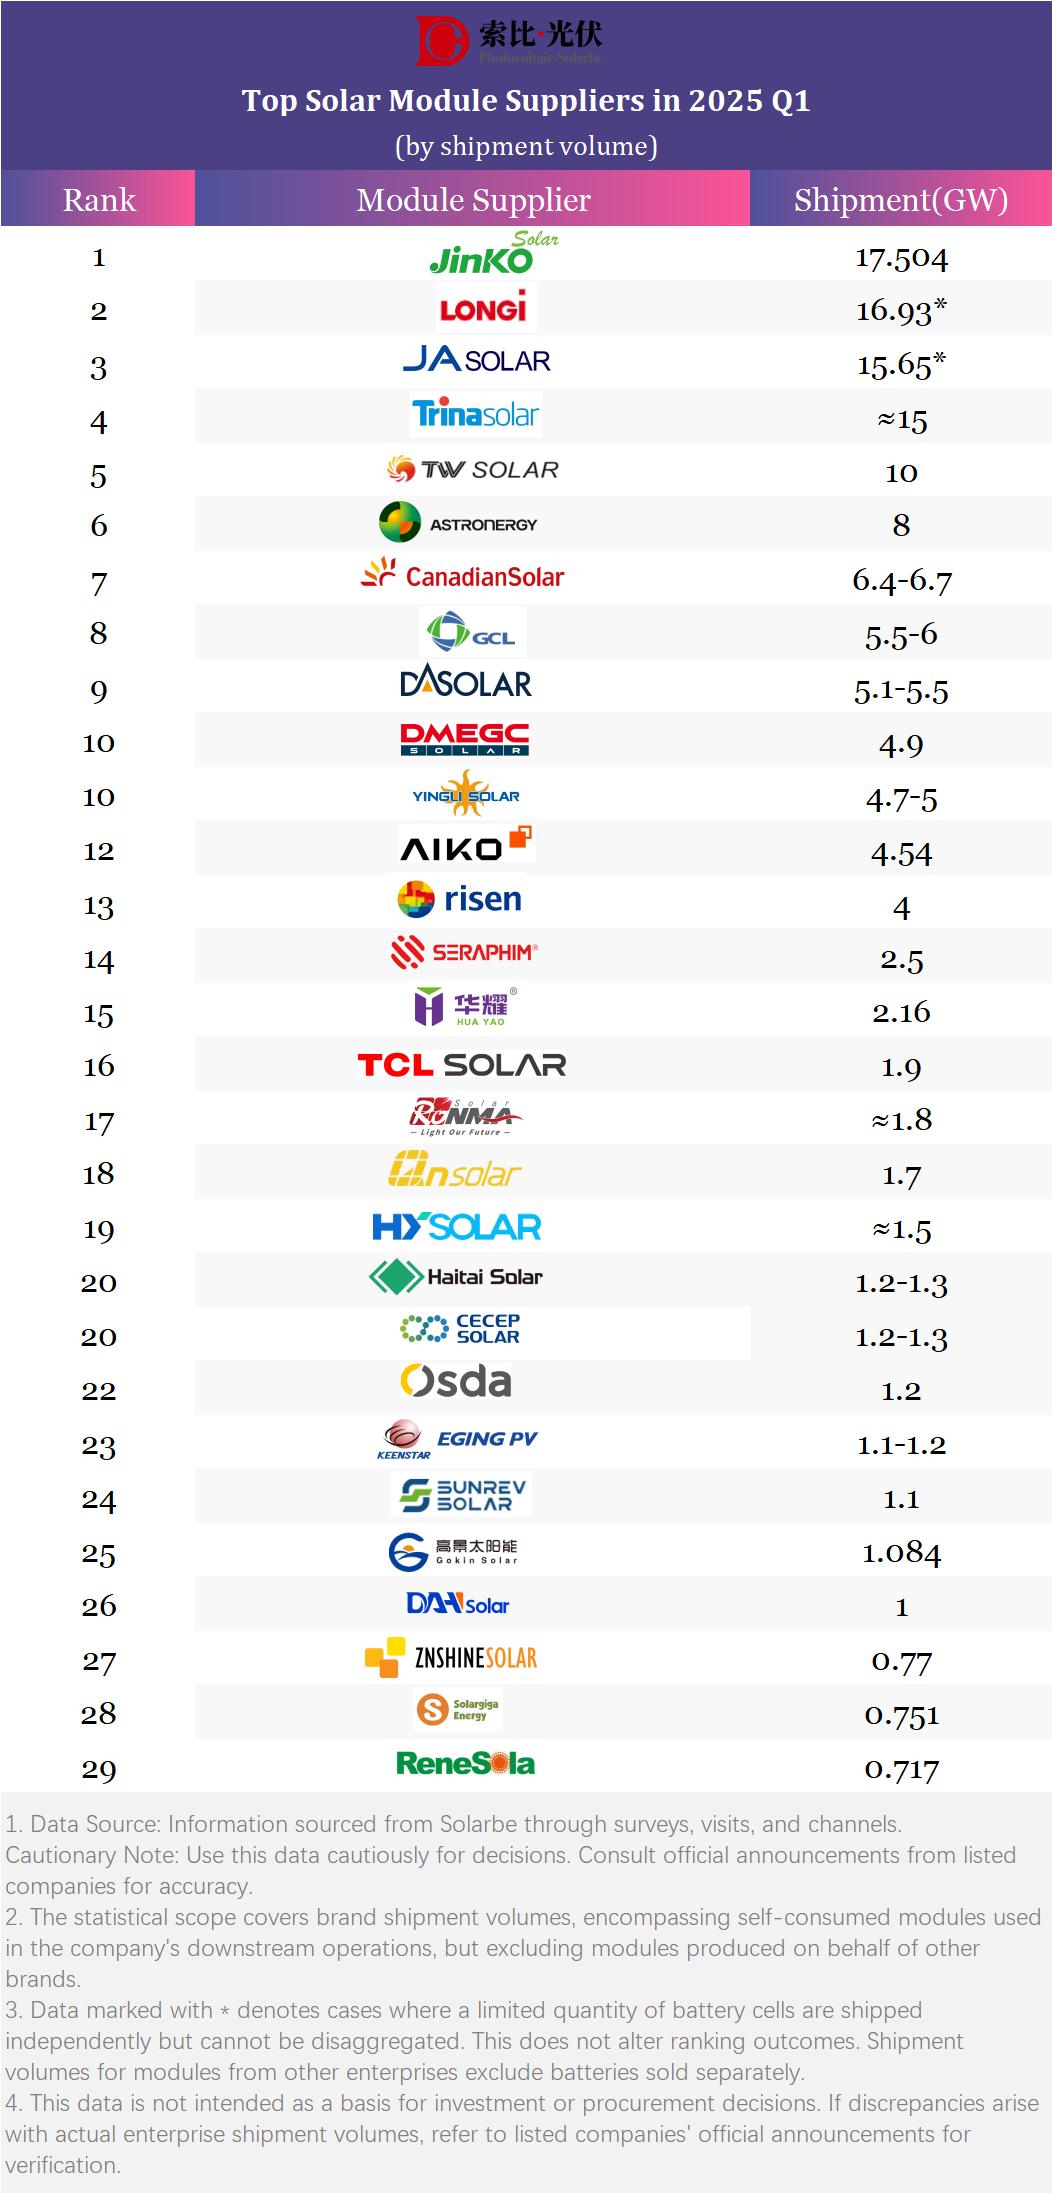
Following two weeks of industry research and validation, Solarbe and Solarbe Consulting jointly released their Q1 2025 PV module shipment rankings for industry reference.
Jinko Solar, LONGi, JA Solar, and Trina Solar maintained their positions as the top four players in Q1, collectively accounting for over 63 GW of shipments and over 45% of market share. While their combined share declined slightly compared to prior periods—due to temporary supply shortages in February-March pushing some developers toward second- and third-tier brands—these leaders’ long-term brand influence remains unshaken. They are expected to reclaim significant global market share in Q2-Q3.
The threshold for the Top 10 ranking remained near 4.9 GW in Q1, slightly exceeding expectations but reasonable for firms with strong overseas presence and downstream development capabilities. Top 10 firms (including ties) controlled 78% of the market, while Top 20 firms captured nearly 95%, aligning with previous tender statistics. For state-owned enterprises, shipment volumes and historical performance are critical metrics for supplier selection.
Interviews revealed that several companies, particularly listed firms, reported year-on-year and quarter-on-quarter shipment declines in Q1. However, this was not indicative of operational issues; some ranked highly despite the data. Listed firms typically recognize revenue upon product delivery, not dispatch, meaning March shipments (a peak domestic demand period) generated revenue in Q2, leading to temporarily lower Q1 shipment figures. Annual performance remains balanced overall.
Industry executives caution against overemphasizing shipment volumes amid intensifying competition and regulatory uncertainties, urging stakeholders to prioritize revenue composition and profitability. They recommend avoiding price wars and excessive focus on shipment rankings, advocating instead for diversified product portfolios and integrated solutions to enhance long-term viability.
Additionally, PV firms are advised to accelerate overseas market engagement through exhibitions and international partnerships. Given potential domestic market tightening in H2, proactive globalization strategies will be crucial for securing H2 2025 and 2026 growth opportunities.


