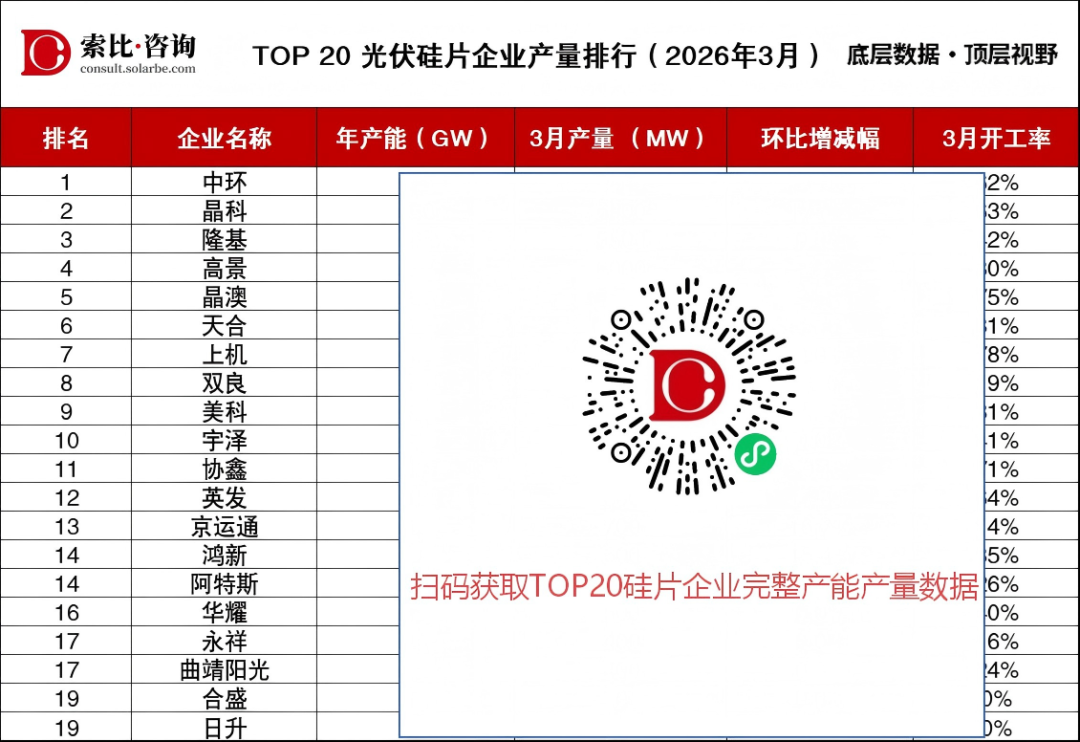
PV Wafer Output Ranking
more capacity output data/report analysis, scan code into small program registration login free view left

Core Data Interpretation
2Q2026 Trend Forecast
List Description
This list is published by Soapy Consulting, focus on the output, capacity matching and production rhythm of China’s PV module enterprises, through the annual production capacity, monthly output, month-on-month changes, operating rate of the four core indicators, multi-dimensional presentation of the real ecology of the production side of the industry.
Data logic: omni-channel cross-verification to ensure objective traceability. Data collection covers official announcements, quarterly financial reports, industry research and third-party verification, and cross-checks annual production capacity, monthly production, chain increase or decrease, and operating rate, taking into account the scale dimension and the operational dimension.
data boundary: this list is a real-time snapshot of the production end. due to differences in production line debugging, order cycle and statistical caliber, the data are only for reference in industry trend research and judgment. If there is any deviation from the actual operation of the enterprise, the official disclosure shall prevail.
Disclaimer
Limited by differences in information disclosure, this list does not guarantee real-time data and absolute accuracy. SOBY CONSULTING MAKES NO WARRANTIES OF ANY KIND OF COMPLETENESS, ACCURACY OR APPLICABILITY OF THE CONTENT OF THE ROLLS, AND SHALL NO RESPONSIBILITY, DIRECT OR INDIRECT, ARISING ANY RESPONSIBILITY ARISING IN RELEASE ON THE INFORMATION OF THE ROLLS. If you need to supplement or amend the list information, please send the information to sunnyliu@solarbe.com.


